There has been a big push for self service business intelligence tools by Microsoft in recent months. The center of this new universe is Microsoft Excel.
I will carry on with talks about Power Query which is a self service ETL add-in for MS Excel. This tool was released in August of 2013. In addition to my blog, the online help is a good place to start learning about this tool.
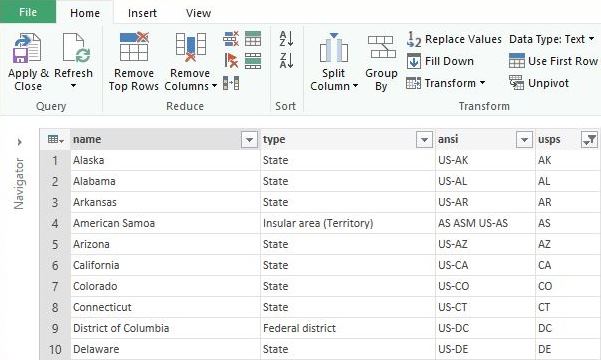
Last time, I demonstrated how the “reduce” section of ribbon has buttons that can refine the number of rows and columns in the source data set. Today, I am going to start covering the “sort” and “transform” sections of the ribbon.

Again, I will be working with the US state abbreviations data set from Wikipedia.
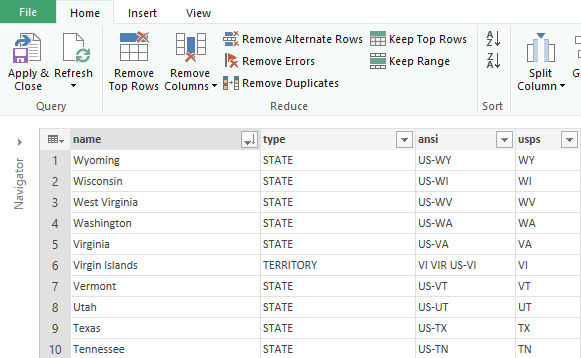
The “sort” operation allows you to order the data in ascending or descending order. The picture below shows states in descending order of abbreviation.
Many times the data we get for analysis is not in the correct format. The core MS Excel application has a “text to columns” operation to parse data that might be in a fixed width or delimited format. Power Query has the “split column” operation instead.
One way to split columns is on fixed length (position).
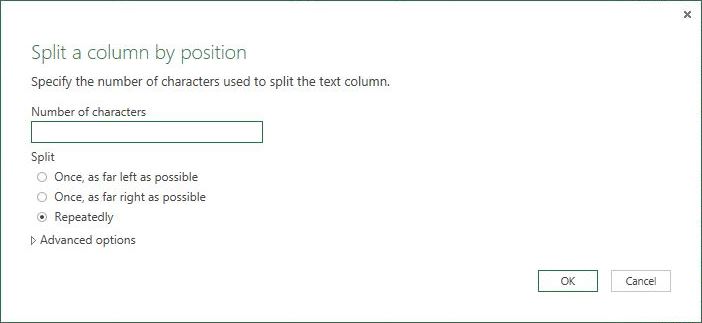
I see this option less flexible than the one built into the core product that allows you to place arrows where divisions occur in a sample preview of the data. In real life, a fixed length file will not have columns with the same number of characters.
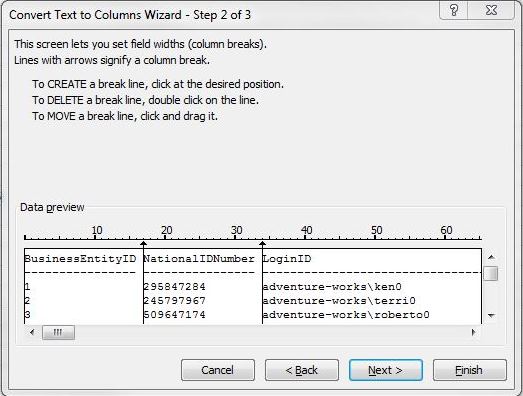
The image below shows the core product converting fixed length data from the [Employee] table in the [HumanResources] schema in the [AdventureWorks2012] database into columns.
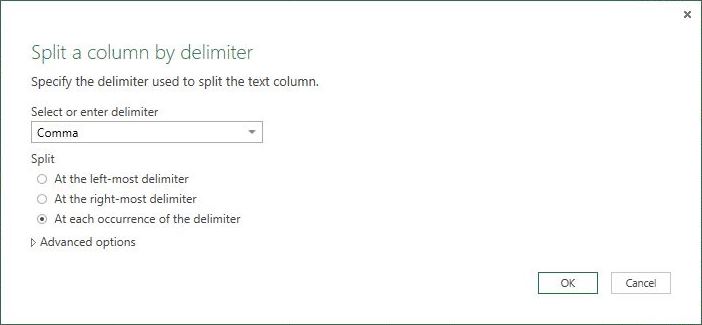
Another way to split columns is on a known character (delimiter). A very common format is comma separated values (CSV) shown below.
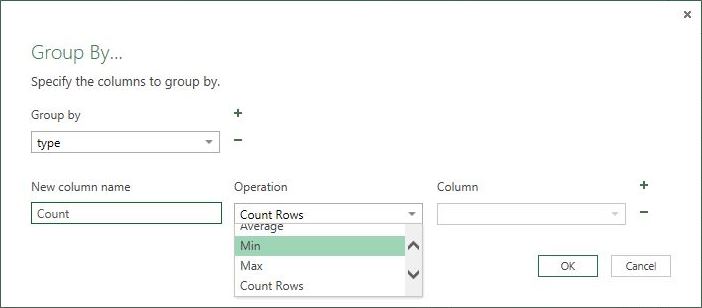
Sometimes we get data for analysis that needs to be aggregated before being used. That is where the “group by” operation comes to play.
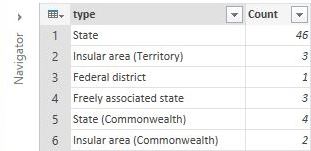
For instance, our US state abbreviations data set can be categorized by type. We might be interested in the number of mail parcels that go out to the islands.
First, the raw data has a type column that we can group by.
Second, we need to decide on what aggregation function we want to use. All the standard SQL functions are available: count, avg, sum, min, and max.
Third, applying the group by operation to our data produces our expected result.
Summing-up this article, there are many operations in the “transform” section of the ribbon that allow you to mold your data into a format that you want. Next time, we will finish exploring the rest of the operators in this section.
Hello. Thank you for the article. Is there more efficient way to parse fixed width csv in PowerQuery, like in standard Excel data import? Currently for every column in csv Table.SplitColumn PowerQuery command should be created.
Thank you! I asked same question at http://superuser.com
http://superuser.com/questions/888203/powerquery-to-parse-fixed-width-csv
There has been so much change in this area, I can not answer off the top of my head. Please check the latest version of Power Query or the Power BI Desktop Designer.