There has been a big push for self service business intelligence tools by Microsoft in recent months. The center of this universe is Microsoft Excel.
I will keep on going with talks about Power Query which is a self service ETL add-in for MS Excel. This tool was released in August of 2013. In addition to my blog, the online help is a good place to start learning about this tool.
Last time, I demonstrated how the “get external data” and “excel data” ribbon buttons can be used to export the source data into the Query editor. Also, we saw how Power Query is very flexible given the large number of import options.
Today, I am going to start flushing out the various operations in the Query Editor that can be used to refine our data.
We first need to open the “Postal Codes” workbook query by selecting the edit option. The following ribbon will show on top of the data.

I am going to concentrate on the “reduce” operations. These operations reduce the number of columns or rows in the resulting data set.
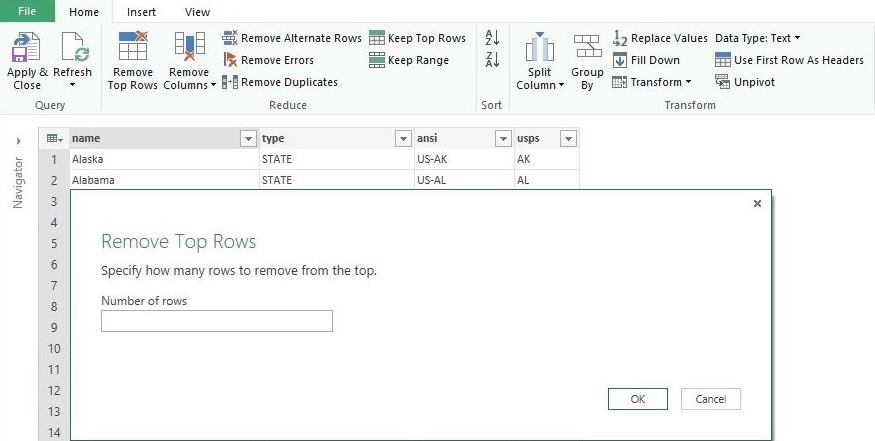
The “remove top rows” operation can be used to delete rows from the top of the data set.
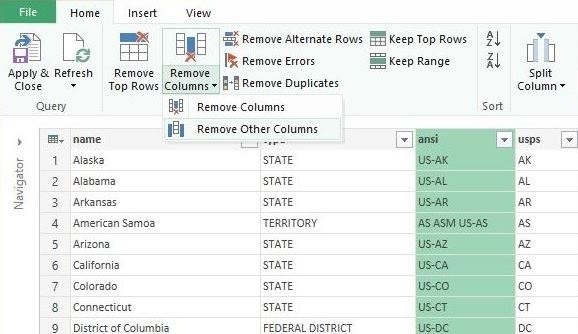
The “remove columns” operation has two choices. Either we can remove a highlighted column or we can remove all columns except for highlighted one.
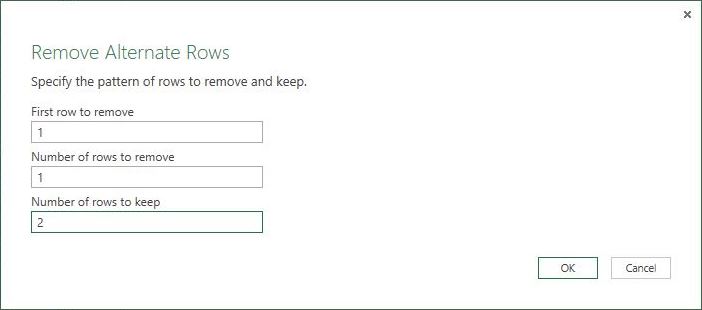
The next operation is kind-of interesting since I can not image a real life usage case. The “remove alternating rows” operation starts at row A and removes B rows and keeps C rows in a alternating pattern.
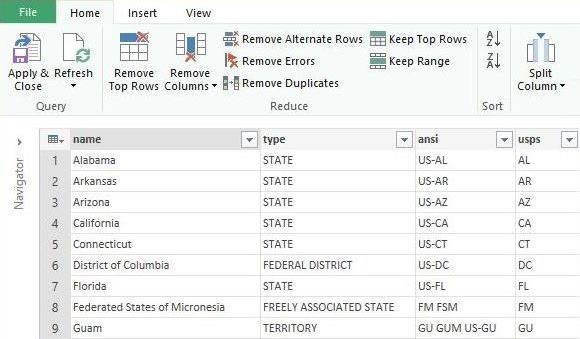
If we apply these choices to the postal codes data set, the following information is left over.
I am avoiding the “remove errors” operation since the easiest way to create an error is to change the target data type. Most data coming into Power Query defaults as a text data type. We will cover this operation when I show you how to change data types in the “transform” section of the ribbon.
Also, I am purposely skipping the “remove duplicates” operation. I will demonstrate this operation when I cover the “combine” section of the ribbon. I will be able to double the data after we cover the “append” operation under that section.
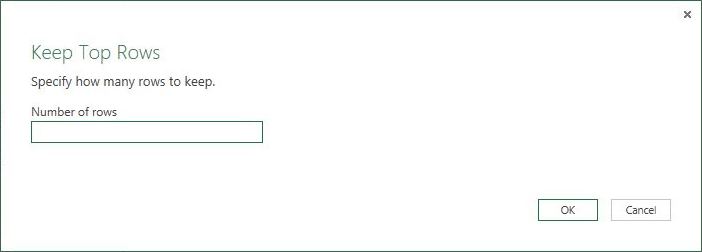
The “keep top rows” operation allows the user to remove rows at the end of the data set. Only the top most N rows will be keep.
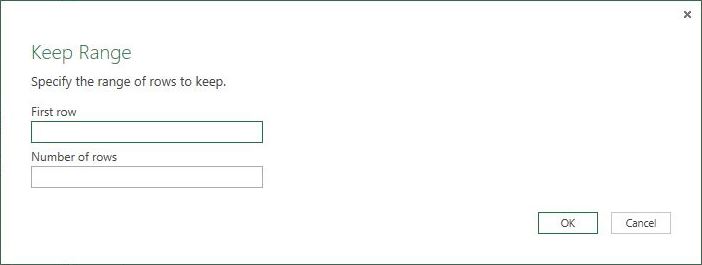
To round off row operators, the “keep range” button allows you to slice out a range of rows.
Just like the RIGHT, LEFT and MID string functions, I consider the REMOVE TOP, KEEP TOP, and KEEP RANGE operators as similar purposed functions that operate on rows of data.
In a nutshell, the Power Query tool supplies the user with tools to reduce the number of rows and/or columns in the source data set. Thus, cleaning up the raw data before being analyzed in the Power Pivot, Power View or Power Map tools.